Blitz News Digest
Stay updated with the latest trends and insights.
Data Drama: Turning Numbers into Narratives
Unlock the secrets behind numbers! Discover how to transform data into compelling stories that captivate and engage readers.
The Art of Storytelling with Data: How to Turn Numbers into Compelling Narratives
In today's data-driven world, storytelling with data has emerged as a crucial skill for businesses and individuals alike. The ability to transform raw numbers into compelling narratives can elevate a presentation, making it more engaging and impactful. To start crafting your narrative, it's vital to have a clear understanding of your audience and the message you wish to convey. A well-structured story typically consists of several key components:
- The Hook - Capture interest with a surprising statistic or a thought-provoking question.
- The Context - Provide background information that helps the audience understand the significance of the data.
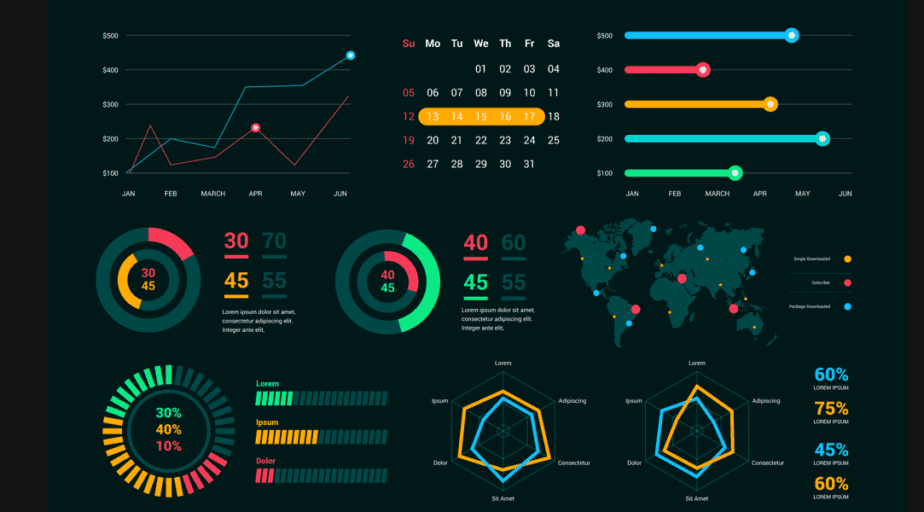
- The Revelation - Present the data itself, accompanied by visual aids such as charts or infographics that simplify complex information.
- The Conclusion - Summarize the key takeaways and illustrate how they apply to real-world scenarios.
Visual elements play an essential role in data storytelling, as they can significantly enhance audience comprehension and retention. Utilizing charts, graphs, and infographics allows you to convey your message more effectively, often revealing patterns that might go unnoticed within raw numbers. Additionally, incorporating emotional elements into your narrative can help bridge the gap between data and human experience. By highlighting personal stories or case studies that correlate with your data, you create a stronger connection with your audience. Ultimately, the art of storytelling with data lies in your ability to weave together facts and emotions, transforming numerical insights into a meaningful and memorable narrative that resonates with your listeners.

Data Visualization Best Practices: Making Your Numbers Speak
Data visualization is an essential skill for anyone looking to present data in a clear and effective manner. To ensure your audience comprehends your data, start by simplifying your visual elements. Avoid clutter by limiting the number of colors, fonts, and data points in your visualizations. Use contrast wisely, employing it to highlight critical information. A clean design allows your audience to focus on the key messages you want to convey, making it easier for them to grasp complex data at a glance.
Another vital practice in data visualization is to maintain consistency throughout your charts and graphs. This includes using the same color schemes, font styles, and labeling conventions across different visualizations. Consistency helps your audience recognize patterns and relationships in the data more easily. Additionally, consider utilizing interactive elements when possible, as they can engage users and encourage exploration. By implementing these best practices, you can ensure that your numbers truly speak and resonate with your audience.
Unlocking the Secrets of Data Interpretation: What the Numbers Really Mean
Data interpretation is a crucial skill that allows us to make sense of the vast amounts of information we encounter daily. It goes beyond merely crunching numbers; it is about uncovering the stories they tell. By employing various techniques such as statistical analysis, visualization tools, and contextual understanding, we can transform raw data into meaningful insights. Unlocking the secrets of data interpretation involves recognizing patterns, identifying trends, and challenging assumptions that often cloud judgment.
To effectively interpret data, one must adopt a systematic approach. Start by defining your objectives clearly, as this will guide your analysis. Next, consider leveraging data visualization techniques, such as graphs and charts, which can simplify complex information and reveal hidden relationships. Remember to listen to the data; it often contains valuable insights that can drive better decision-making. Ultimately, the meaning behind the numbers becomes clearer when we analyze them critically and contextually, leading to informed conclusions that truly reflect the reality of the situation.